Everybody want’s to know who will win the 2020 Democratic Primary. Our team at Berkeley is here to review some of the storylines so far in the race, and give our impressions on where the race might be headed. This analysis is based on the data described in the Measuring Hype page and the source can be found in our panel models R-markdown file.
NLP Topics
The goal of this analysis is to use the LDA topic features described in our Modeling Political Topics post to model candidate success so far in the primary. You can use the dashboard below to interactively explore how candidates and topics interact.
How To Measure Support
Our curated 2020 primary dataset contains 5 variables that could be used to measure the hype surrounding a candidate. We included:
- Nationwide polling average
- Count of individual donations
- Sum of individual donations
- Count of small donations
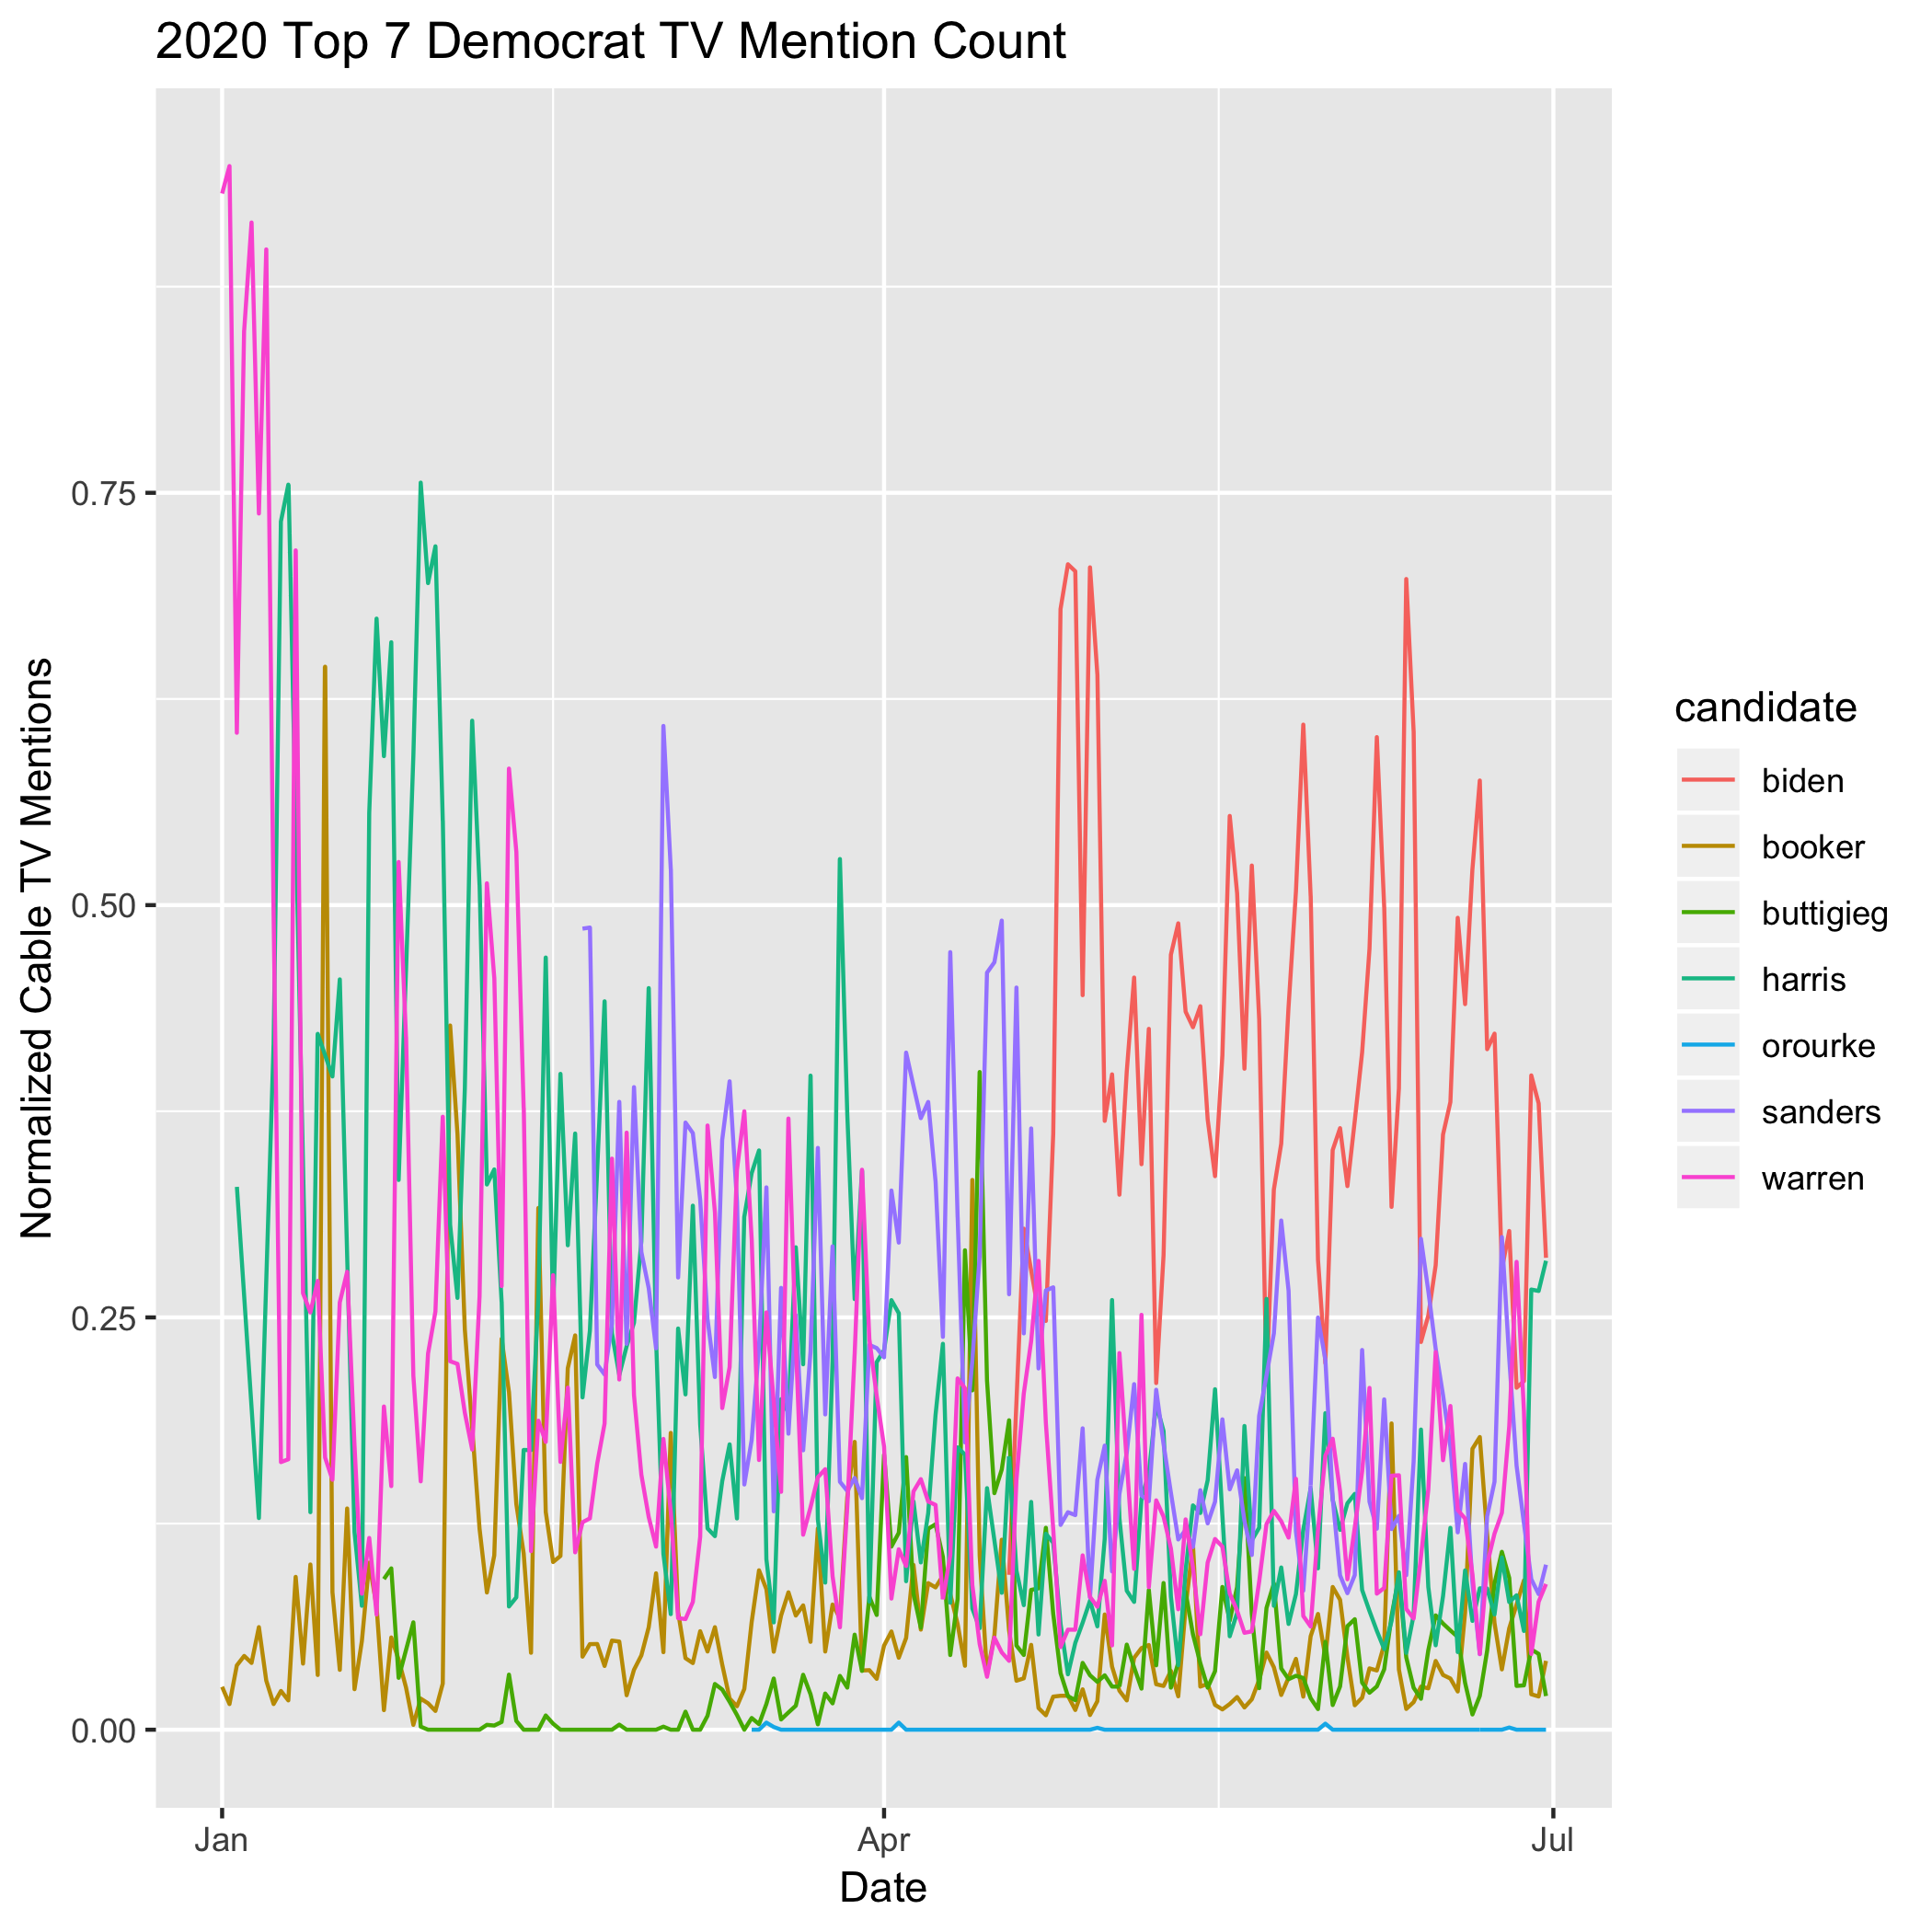
- Count of candidate mentions on cable TV
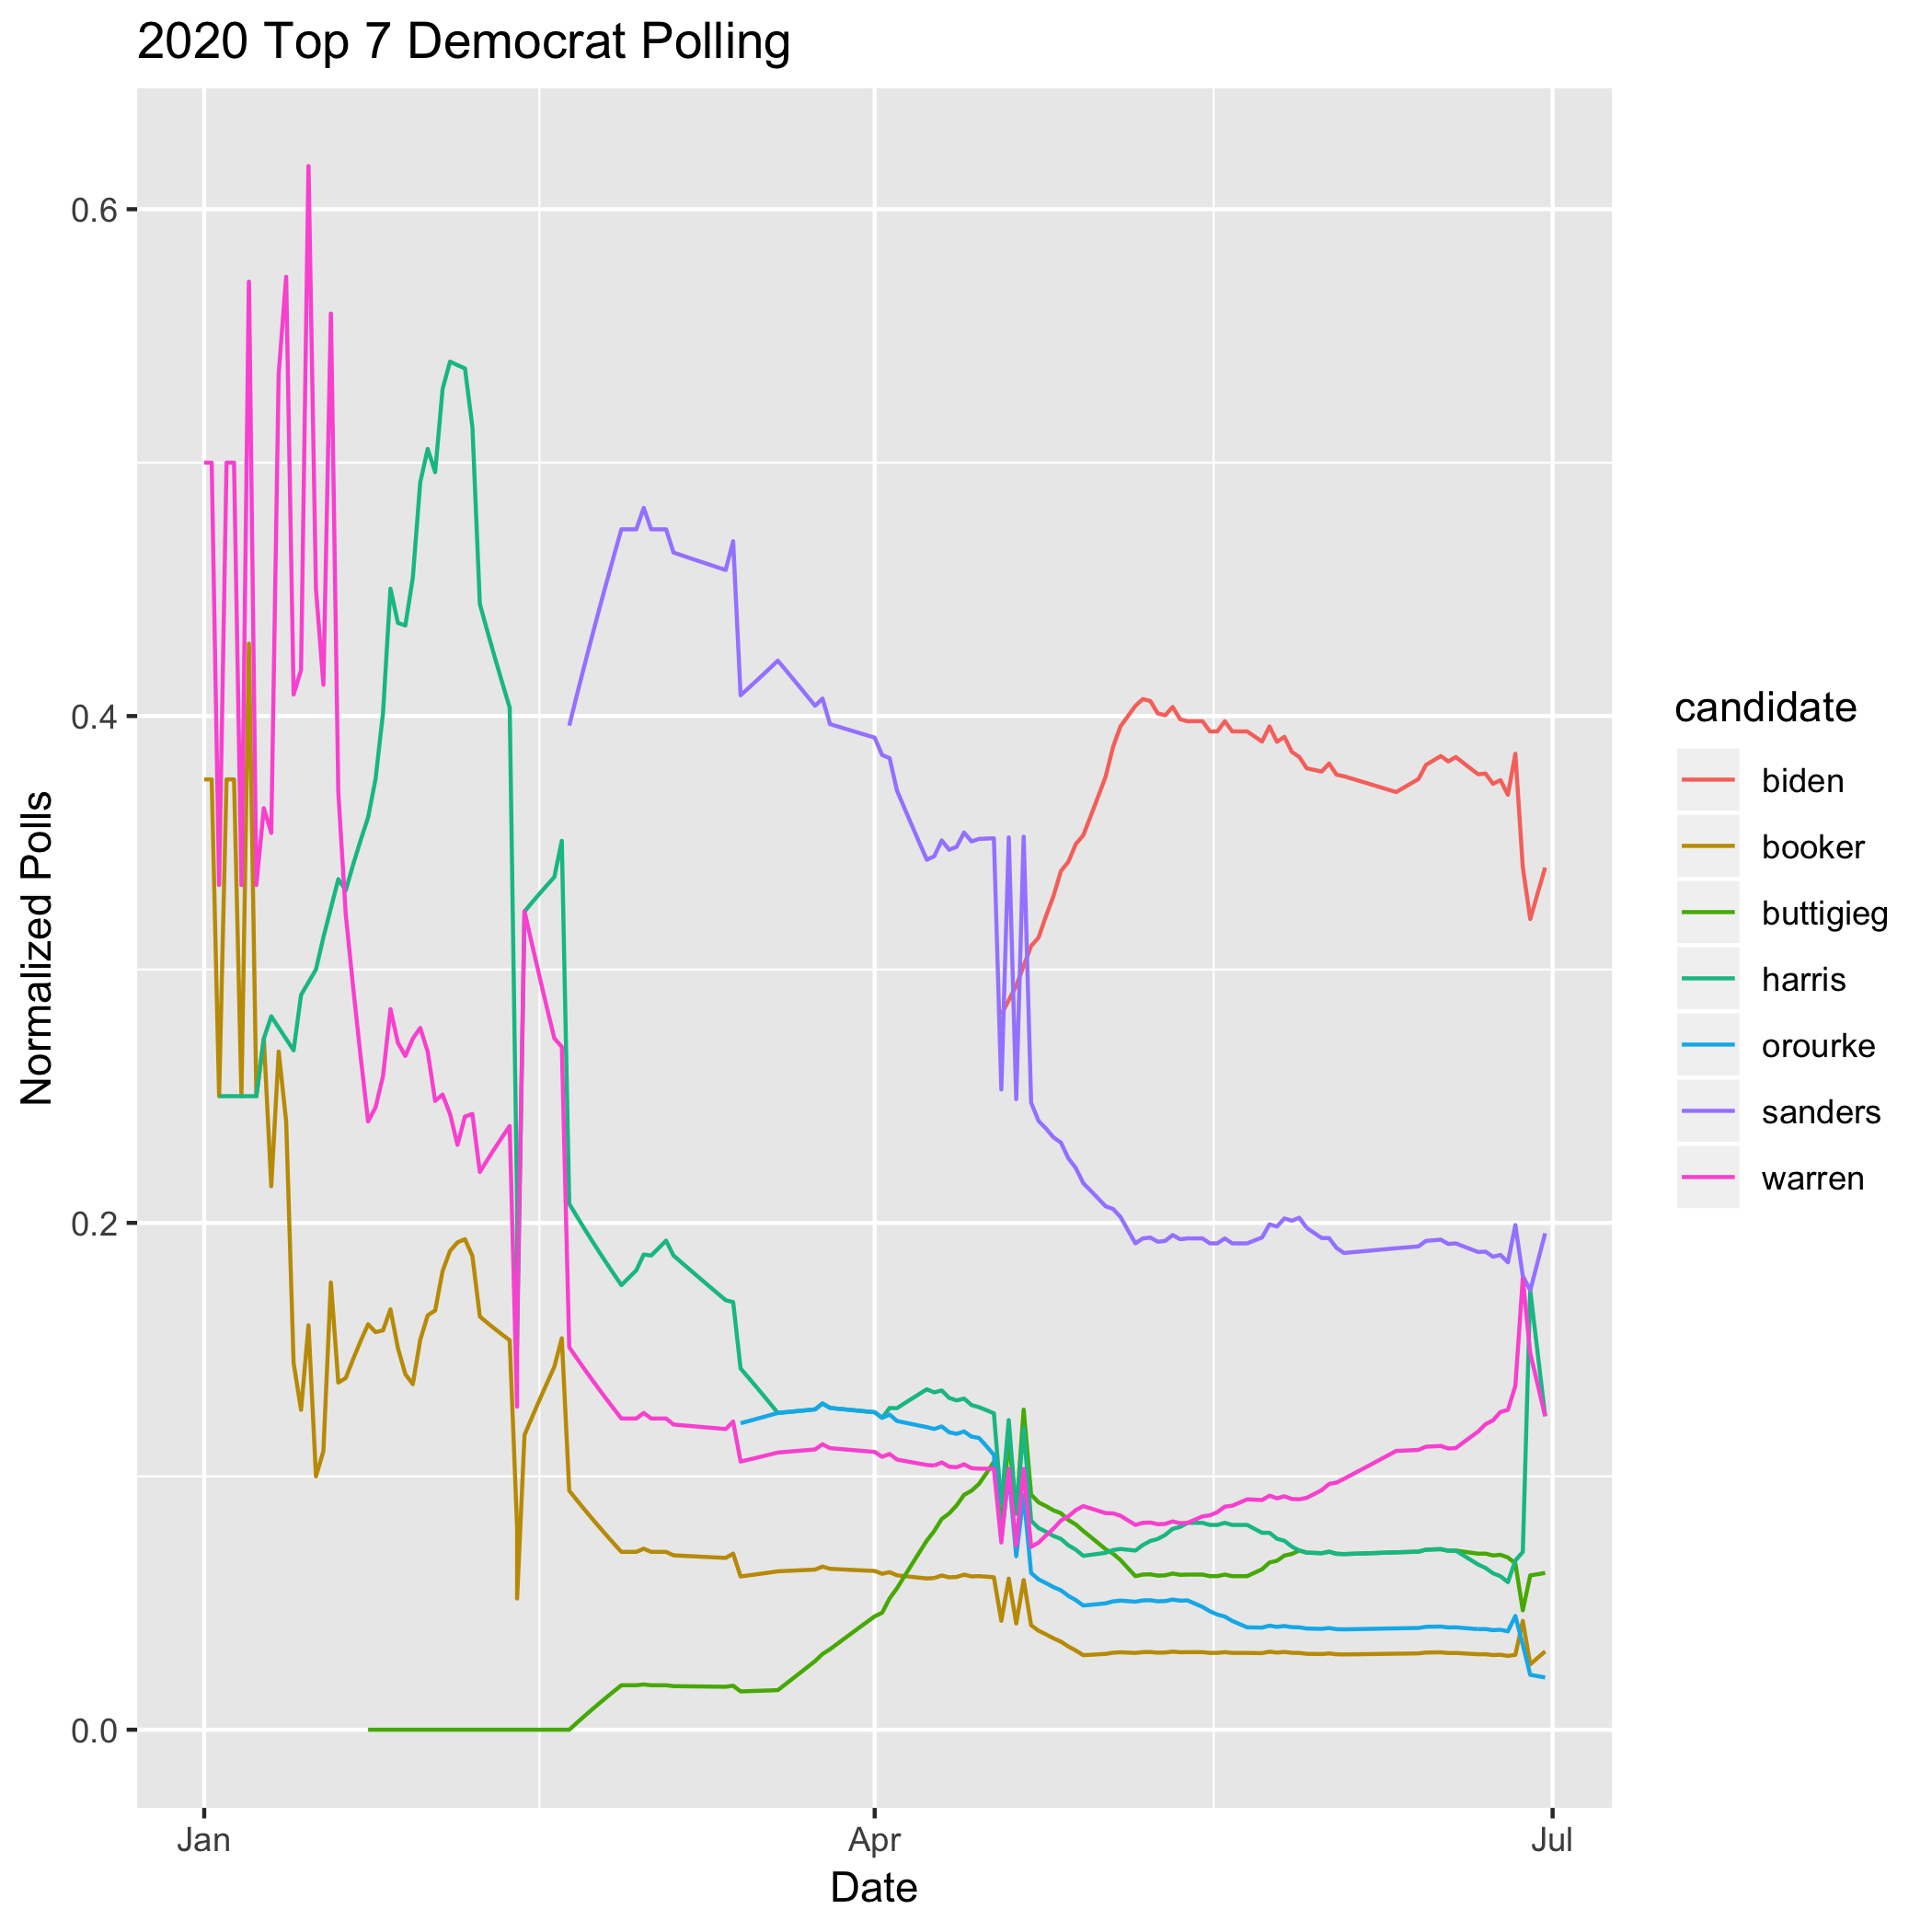
Additionally we looked at each variable in two ways - first as a raw measurement and second as a normalized score relative to the field of candidates. There’s a case for any one of these measurements (or a combination thereof) to be used as a measurement for how a candidate is doing. In fact all of those numbers are reported on regularly during the primary. However our research led us to polling as the best outcome variable at this point in the primary.
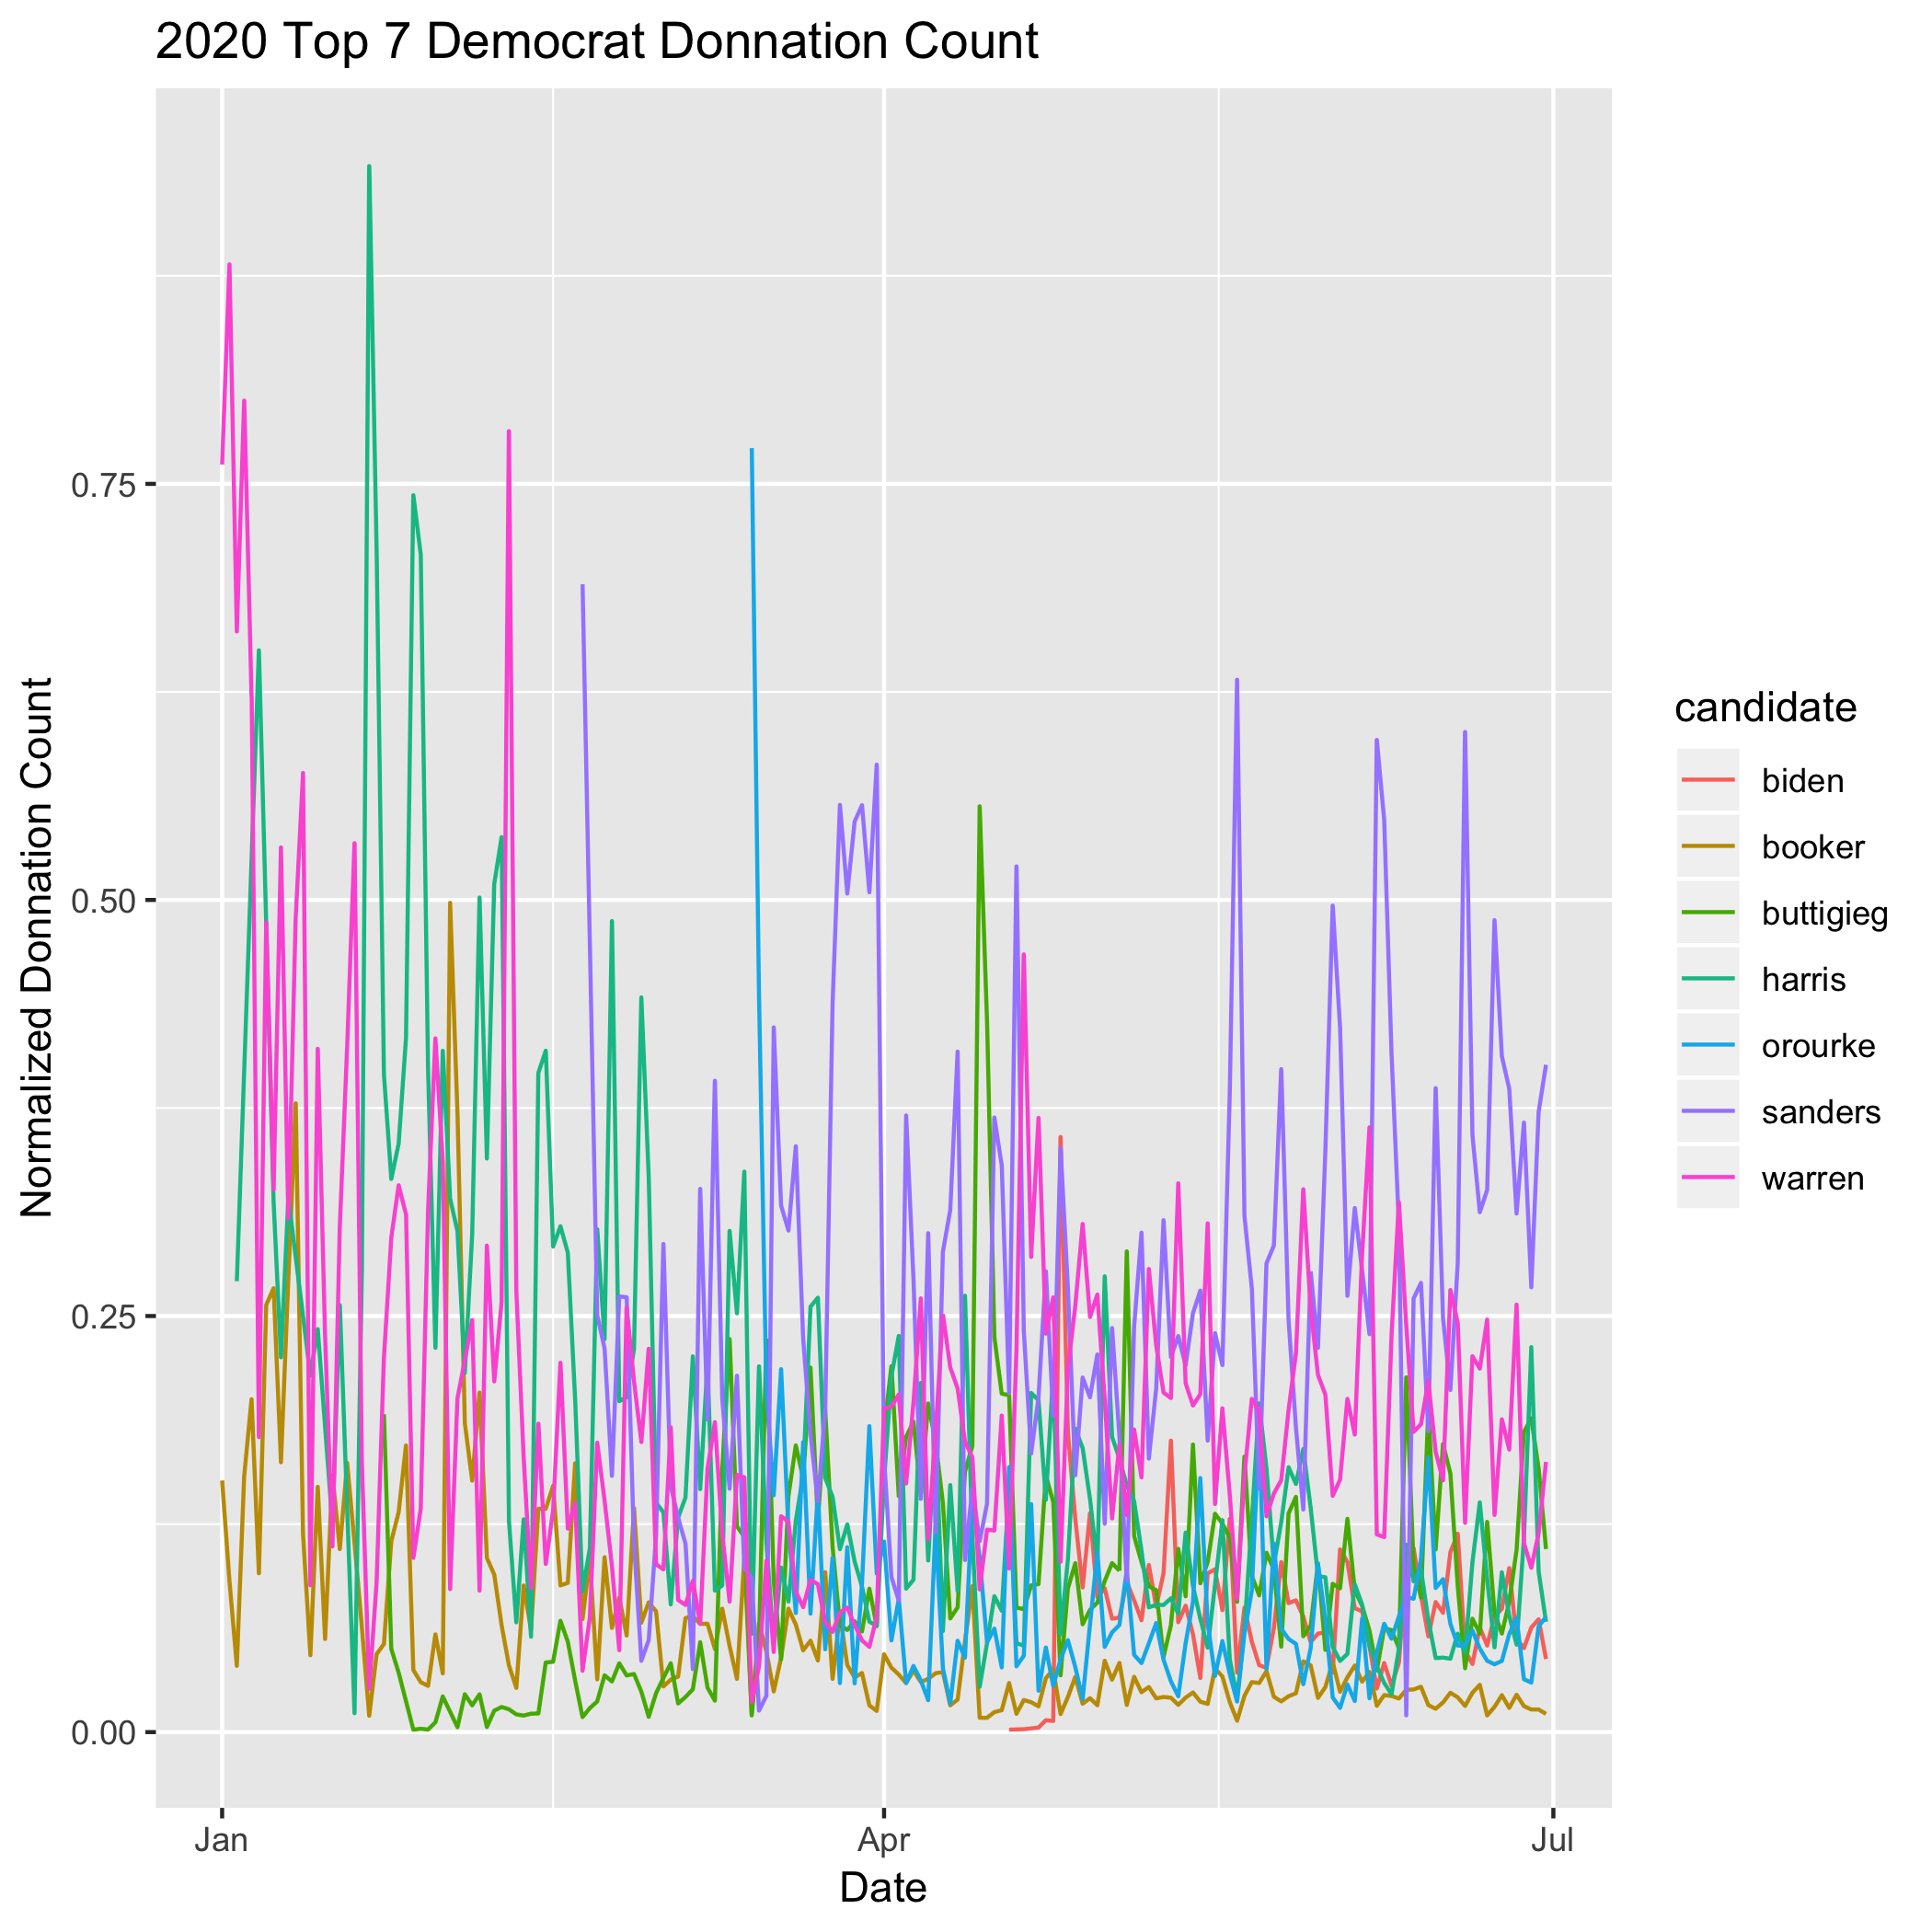
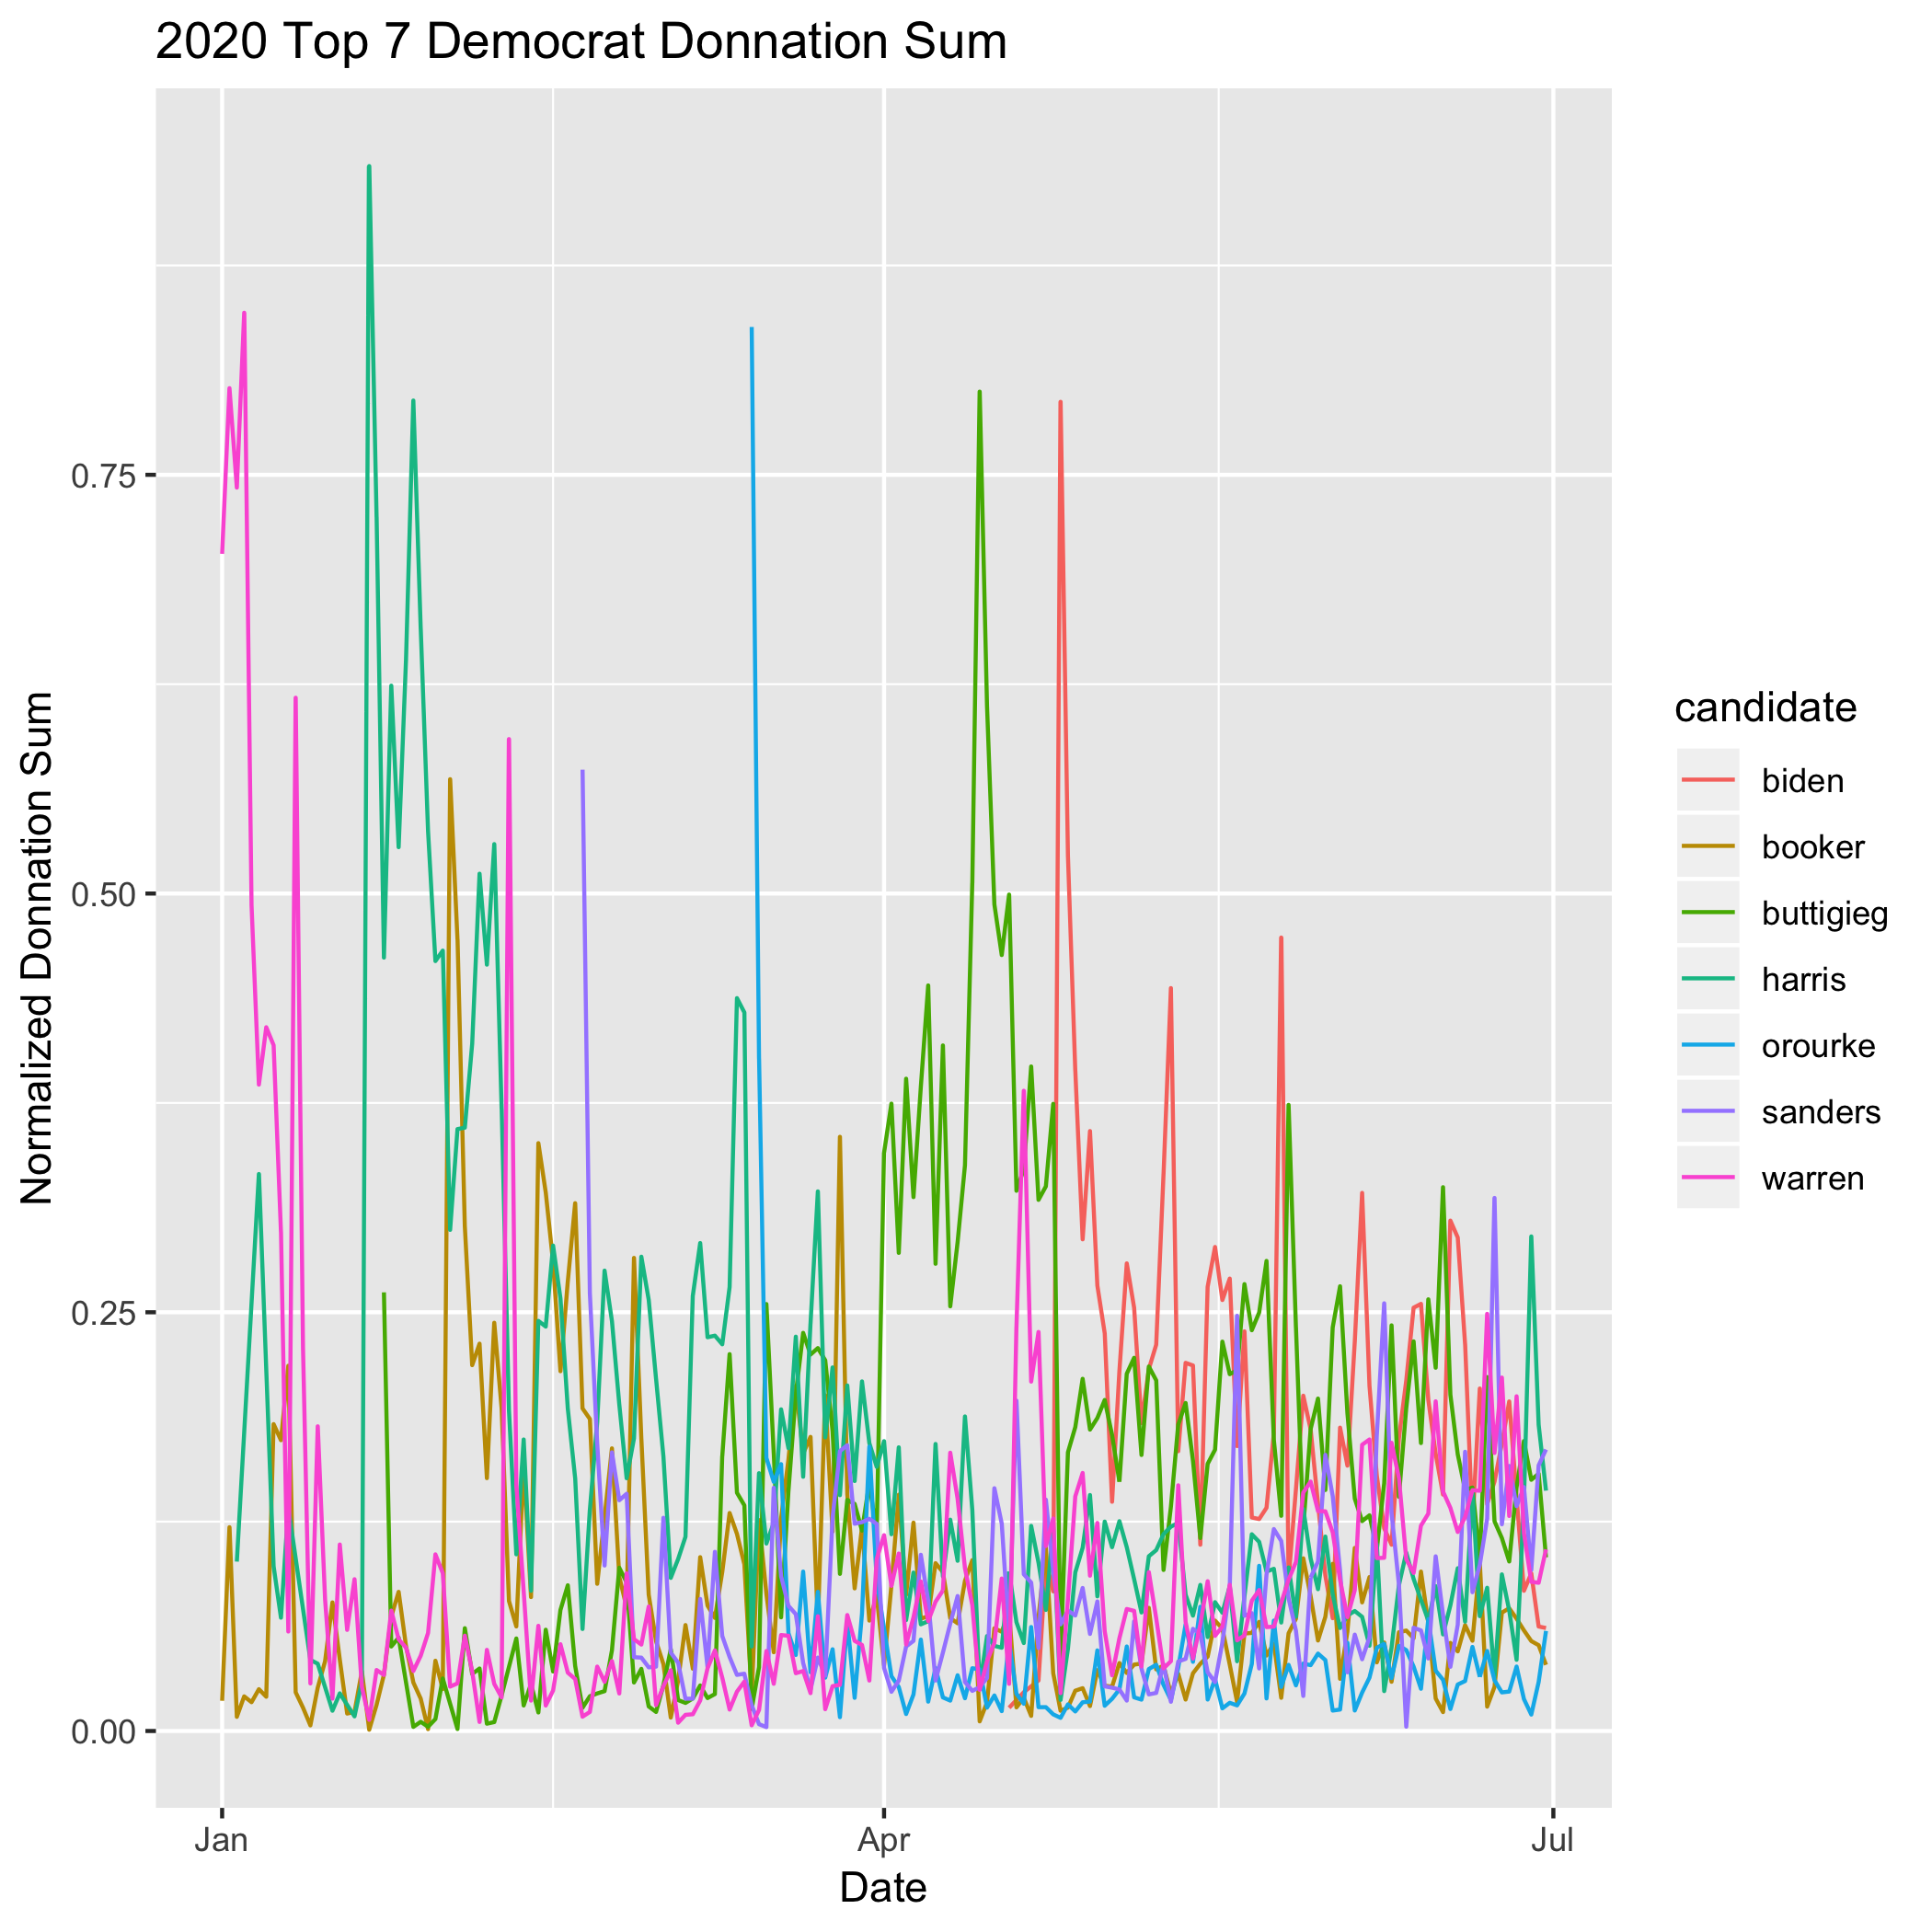
Donation derived variables, especially in the early stages of a race, are largely explained by each campaign’s fundraising effort. For example, donation drives usually include direct emails to supporters and digital advertising. This inflates donor count numbers for a week or so at a time in a way that is completely uncorrelated with the news cycle. Another example is bundling, which generates large sums of money on a single day by bringing together high net-worth donors for a meet-and-greet that usually includes the maximum allowable donation to the campaign. Therefore using donations as a proxy for hype was ineffective, since the outcome was not correlated with our measurements of the media cycle.
TV mentions presented a different challenge, in that they were easily measured by our NLP features because they measured the same underlying effect. That is, cable TV mentions were a proxy for hype within the media ecosystem, but not necessarily a good measure of hype amoung voters.
Polling turned out to be the best measure of candidate support. Polling has many desireable characteristics: it changes slowly, it’s measured frequently, and they are professional organizations curating the data. Additionally there is existing research that supports polls as the best measurement of the eventual winner of the campaign, with the caveat that they are not perfectly predictive. But for our purposes they work well enough to measure day-to-day changes in the excitement around candidates.
Measuring Candidates Individually
In modeling polling as a function of topics from the media ecosystem, we had to make difficult decisions regarding what effects to measure. We ideally wanted to determine what effects broadly lifted candidates or hurt them, but we quickly learned that polling is a zero sum game. Often single issues are tied to multiple candidates, hurting one while helping another. Case in point is the Biden-Harris-Bussing conflict in the first debate.
We eventually realized that the only way measure how a topic effected the field was to measure it on each candidate individually. We performed a grid search and found that effects varied wildly. In the final versions of the models below, we strived for parsimony. We pruned features that were not statistically significant, had poor predictive power, and were ambiguous from a narrative perspective. Each model is a simple linear regression of time series topics on the polling time series for a given candidate. We have limited this post to the current top 5 candidates.
Joe Biden
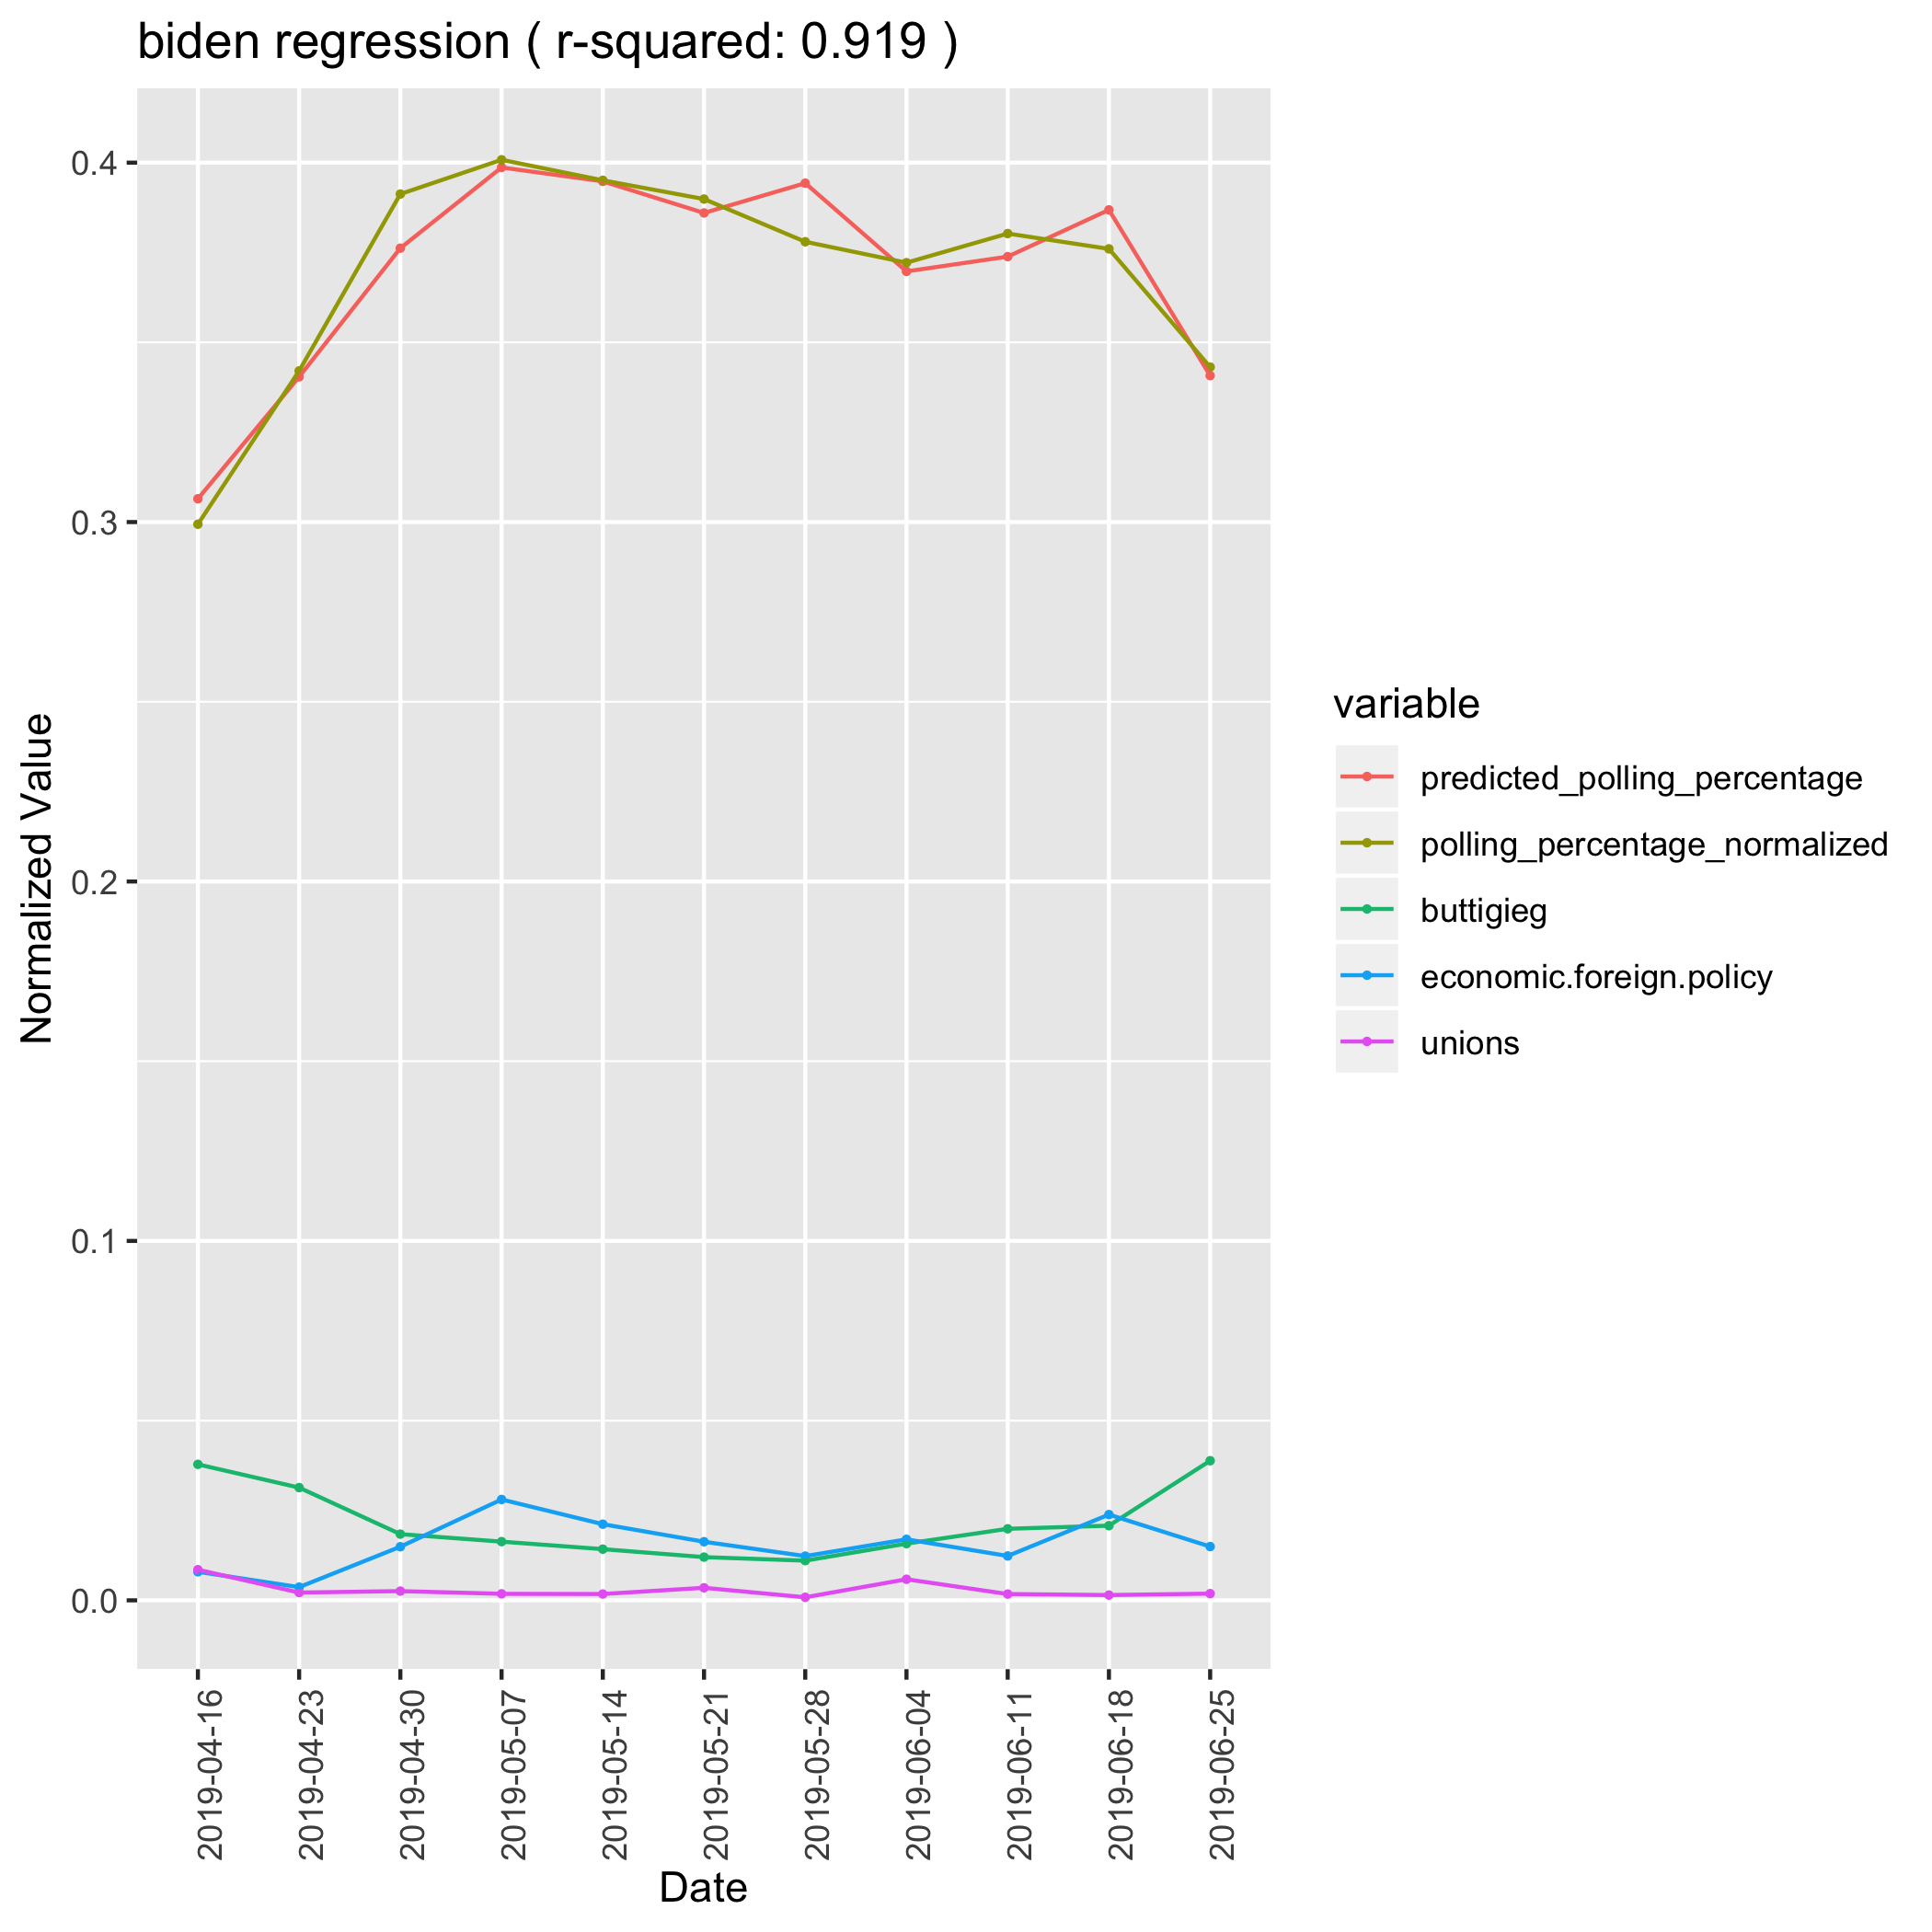
Joe Biden entered the race in mid-April, giving us only 11 weeks of data on his campaign. However unlike the other candidates, his polling has been pretty stable over that time period, staying between 30% and 40% support. For that reason, it was hard to say if his predictive features were real effects or just spurious correlations. We can say from intuition about the race that Biden is likely to perform well if people are talking about his experience, and unlikely to perform well if people are talking about his voters or his coalition. For that reason we believe that the foreign policy topic is correct in it’s strong positive coefficient, and that unions and buttigieg are correct in having negative coefficients. Those last two topics likely relate to concerns about Biden building a broad enough coalition.
Biden Linear Regression Model
| Coefficient | Value |
|---|---|
| (Intercept) | 0.41058 |
| (0.38671) | |
| buttigieg | -1.88319 |
| 0.69337 | |
| economic.foreign.policy | (1.16820) |
| 0.54417 | |
| unions | -4.20282 |
| (1.54095) |
Elizabeth Warren
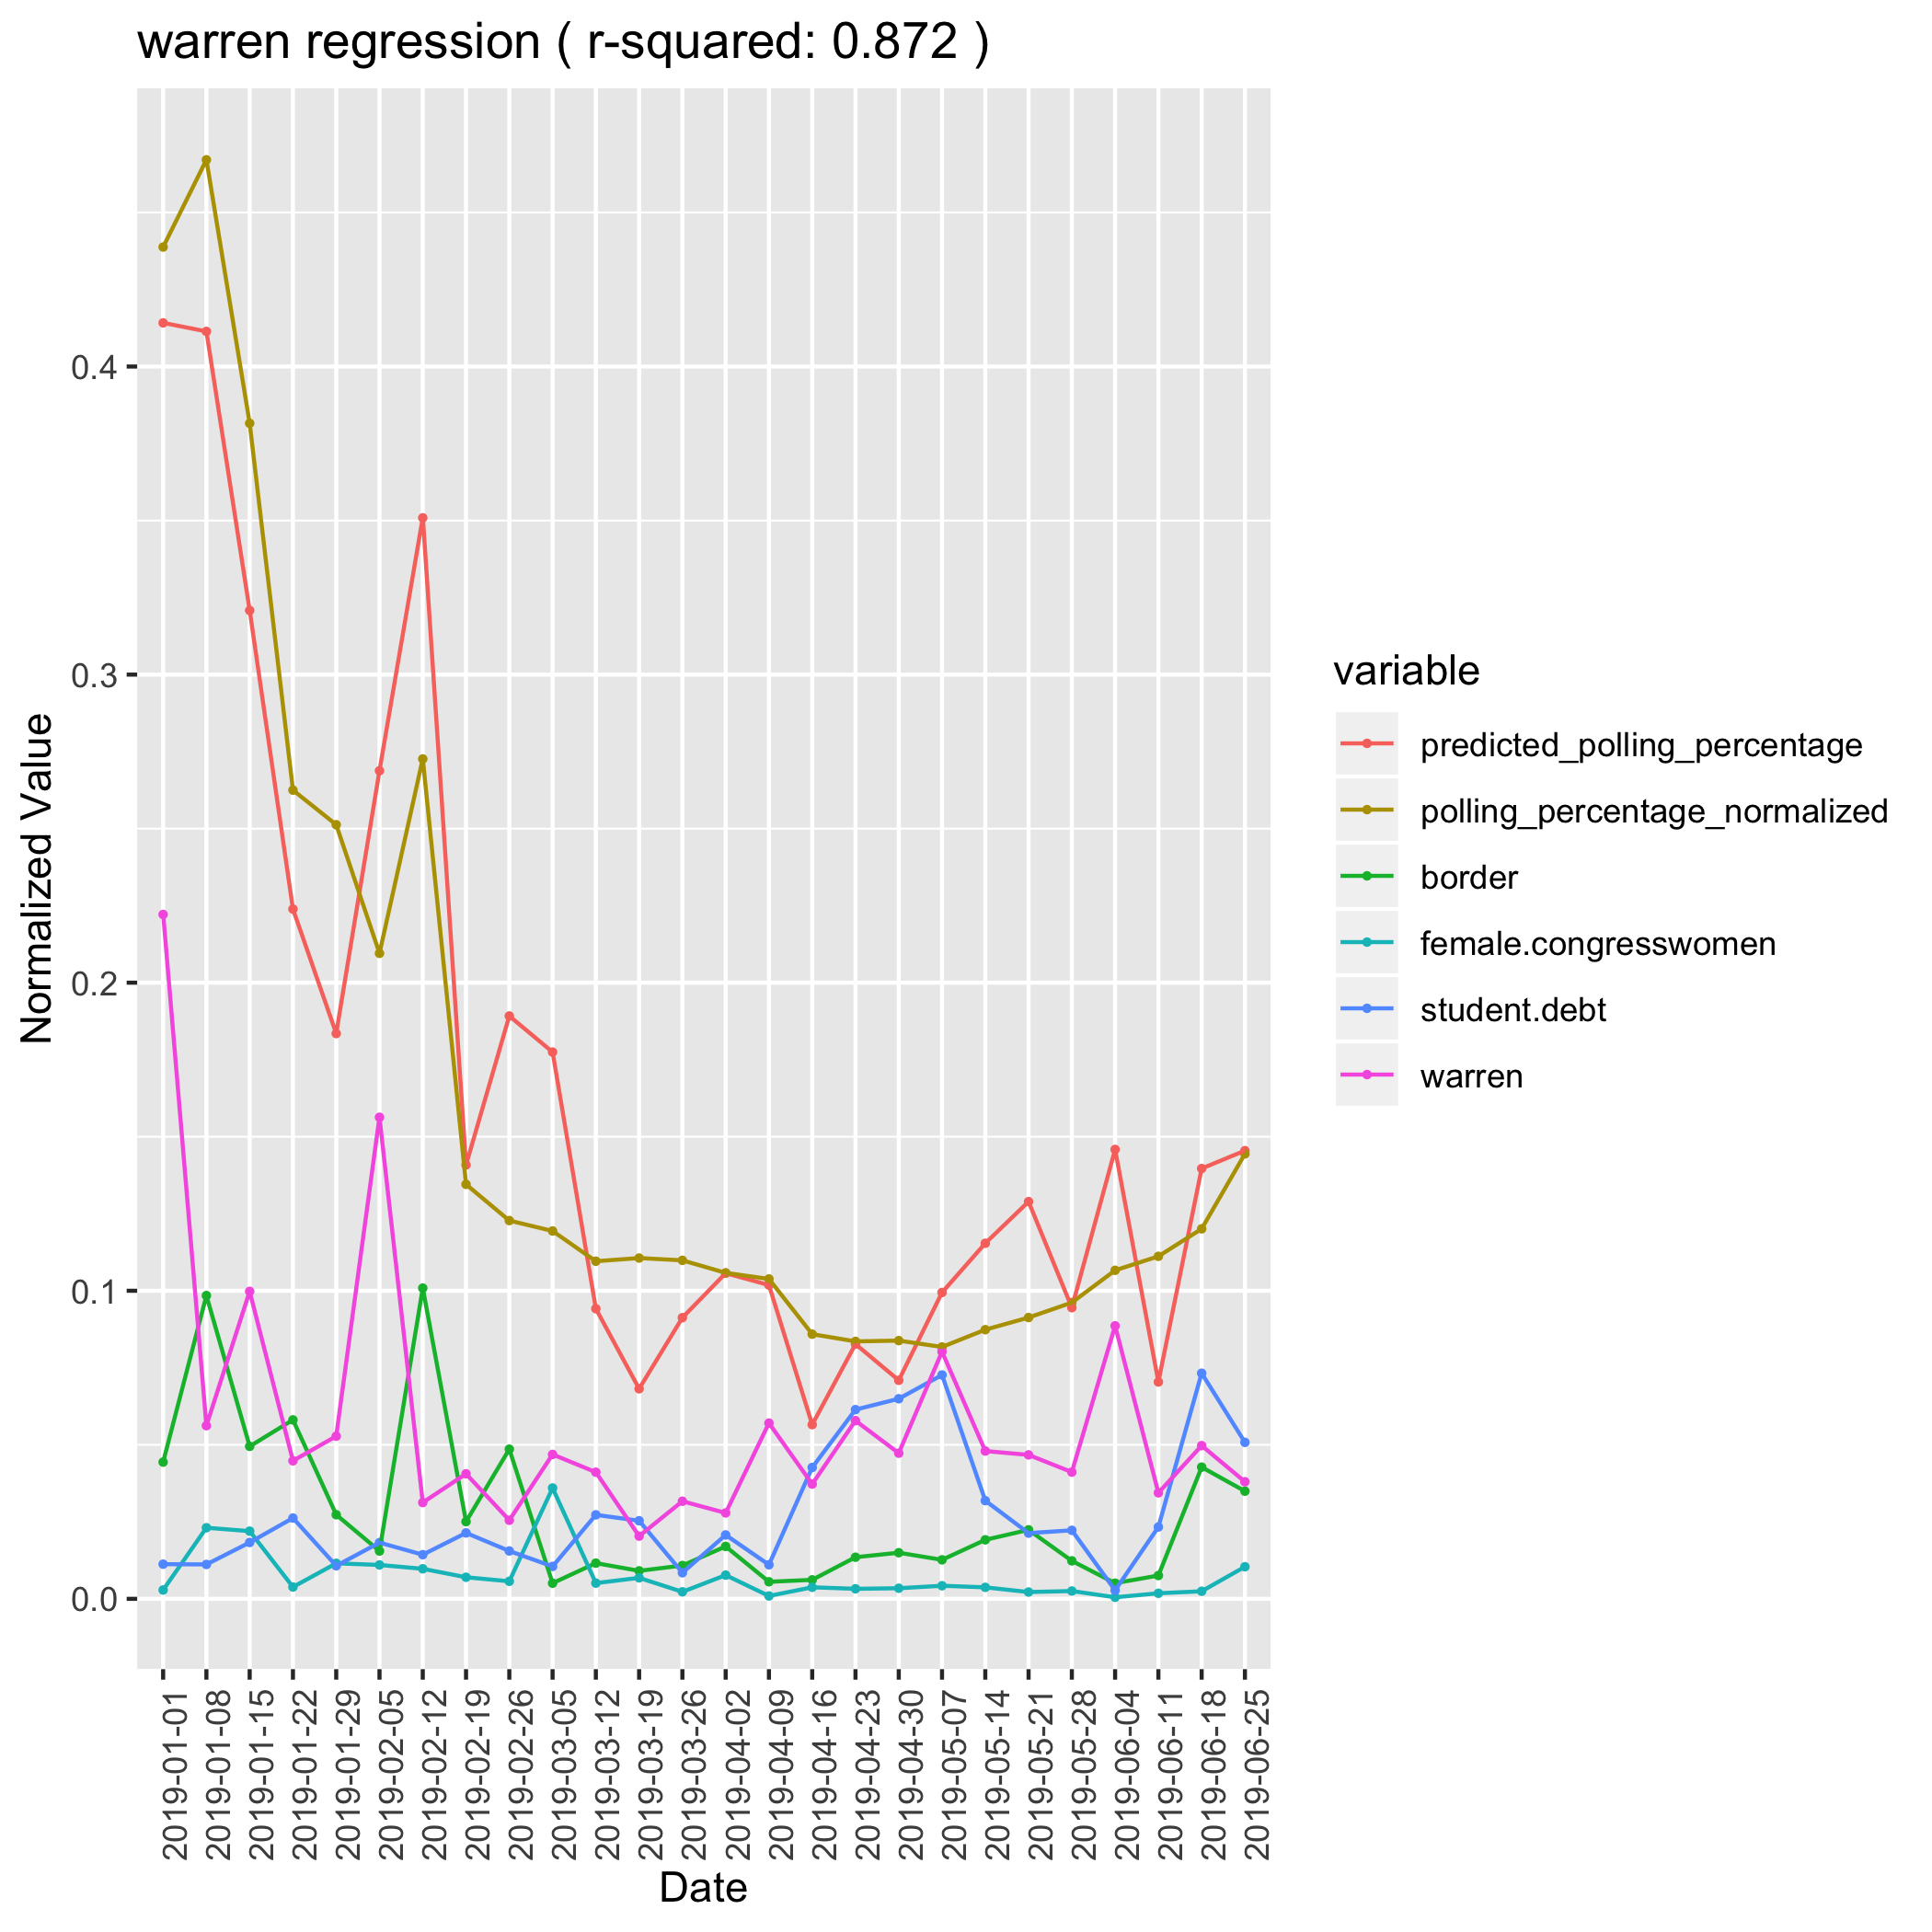
Elizabeth Warren exemplifies what we were hoping to find in our model. We explained 87% of the variation in her poll numbers using just four of our media topic features. Additionally, Warren demonstrated an effect we suspected was playing a major role in this primary - identity politics. When Elizabeth Warren is mentioned in the media in association with her identity characteristics: Massachusetts, Senator, Professor, Harvard, Woman - she tends to rise in the polls. Even more interesting, one of her signature policies, erasing student loan debt, has a negative impact on her polling. This demonstrates that voters are excited about who the candidates are but that excitement might return to earth when they understand what the candidates stand for. Especially since forgiving student loan debt is a broadly unpopular policy.
Warren Linear Regression Model
| Coefficient | Value |
|---|---|
| (Intercept) | 0.02531 |
| (0.02446) | |
| border | 2.74059 |
| (0.35074) | |
| female.congresswomen | 2.53233 |
| (1.16167) | |
| student.debt | -0.95058 |
| (0.45021) | |
| warren | 1.21846 |
| (0.20340) |
Kamala Harris
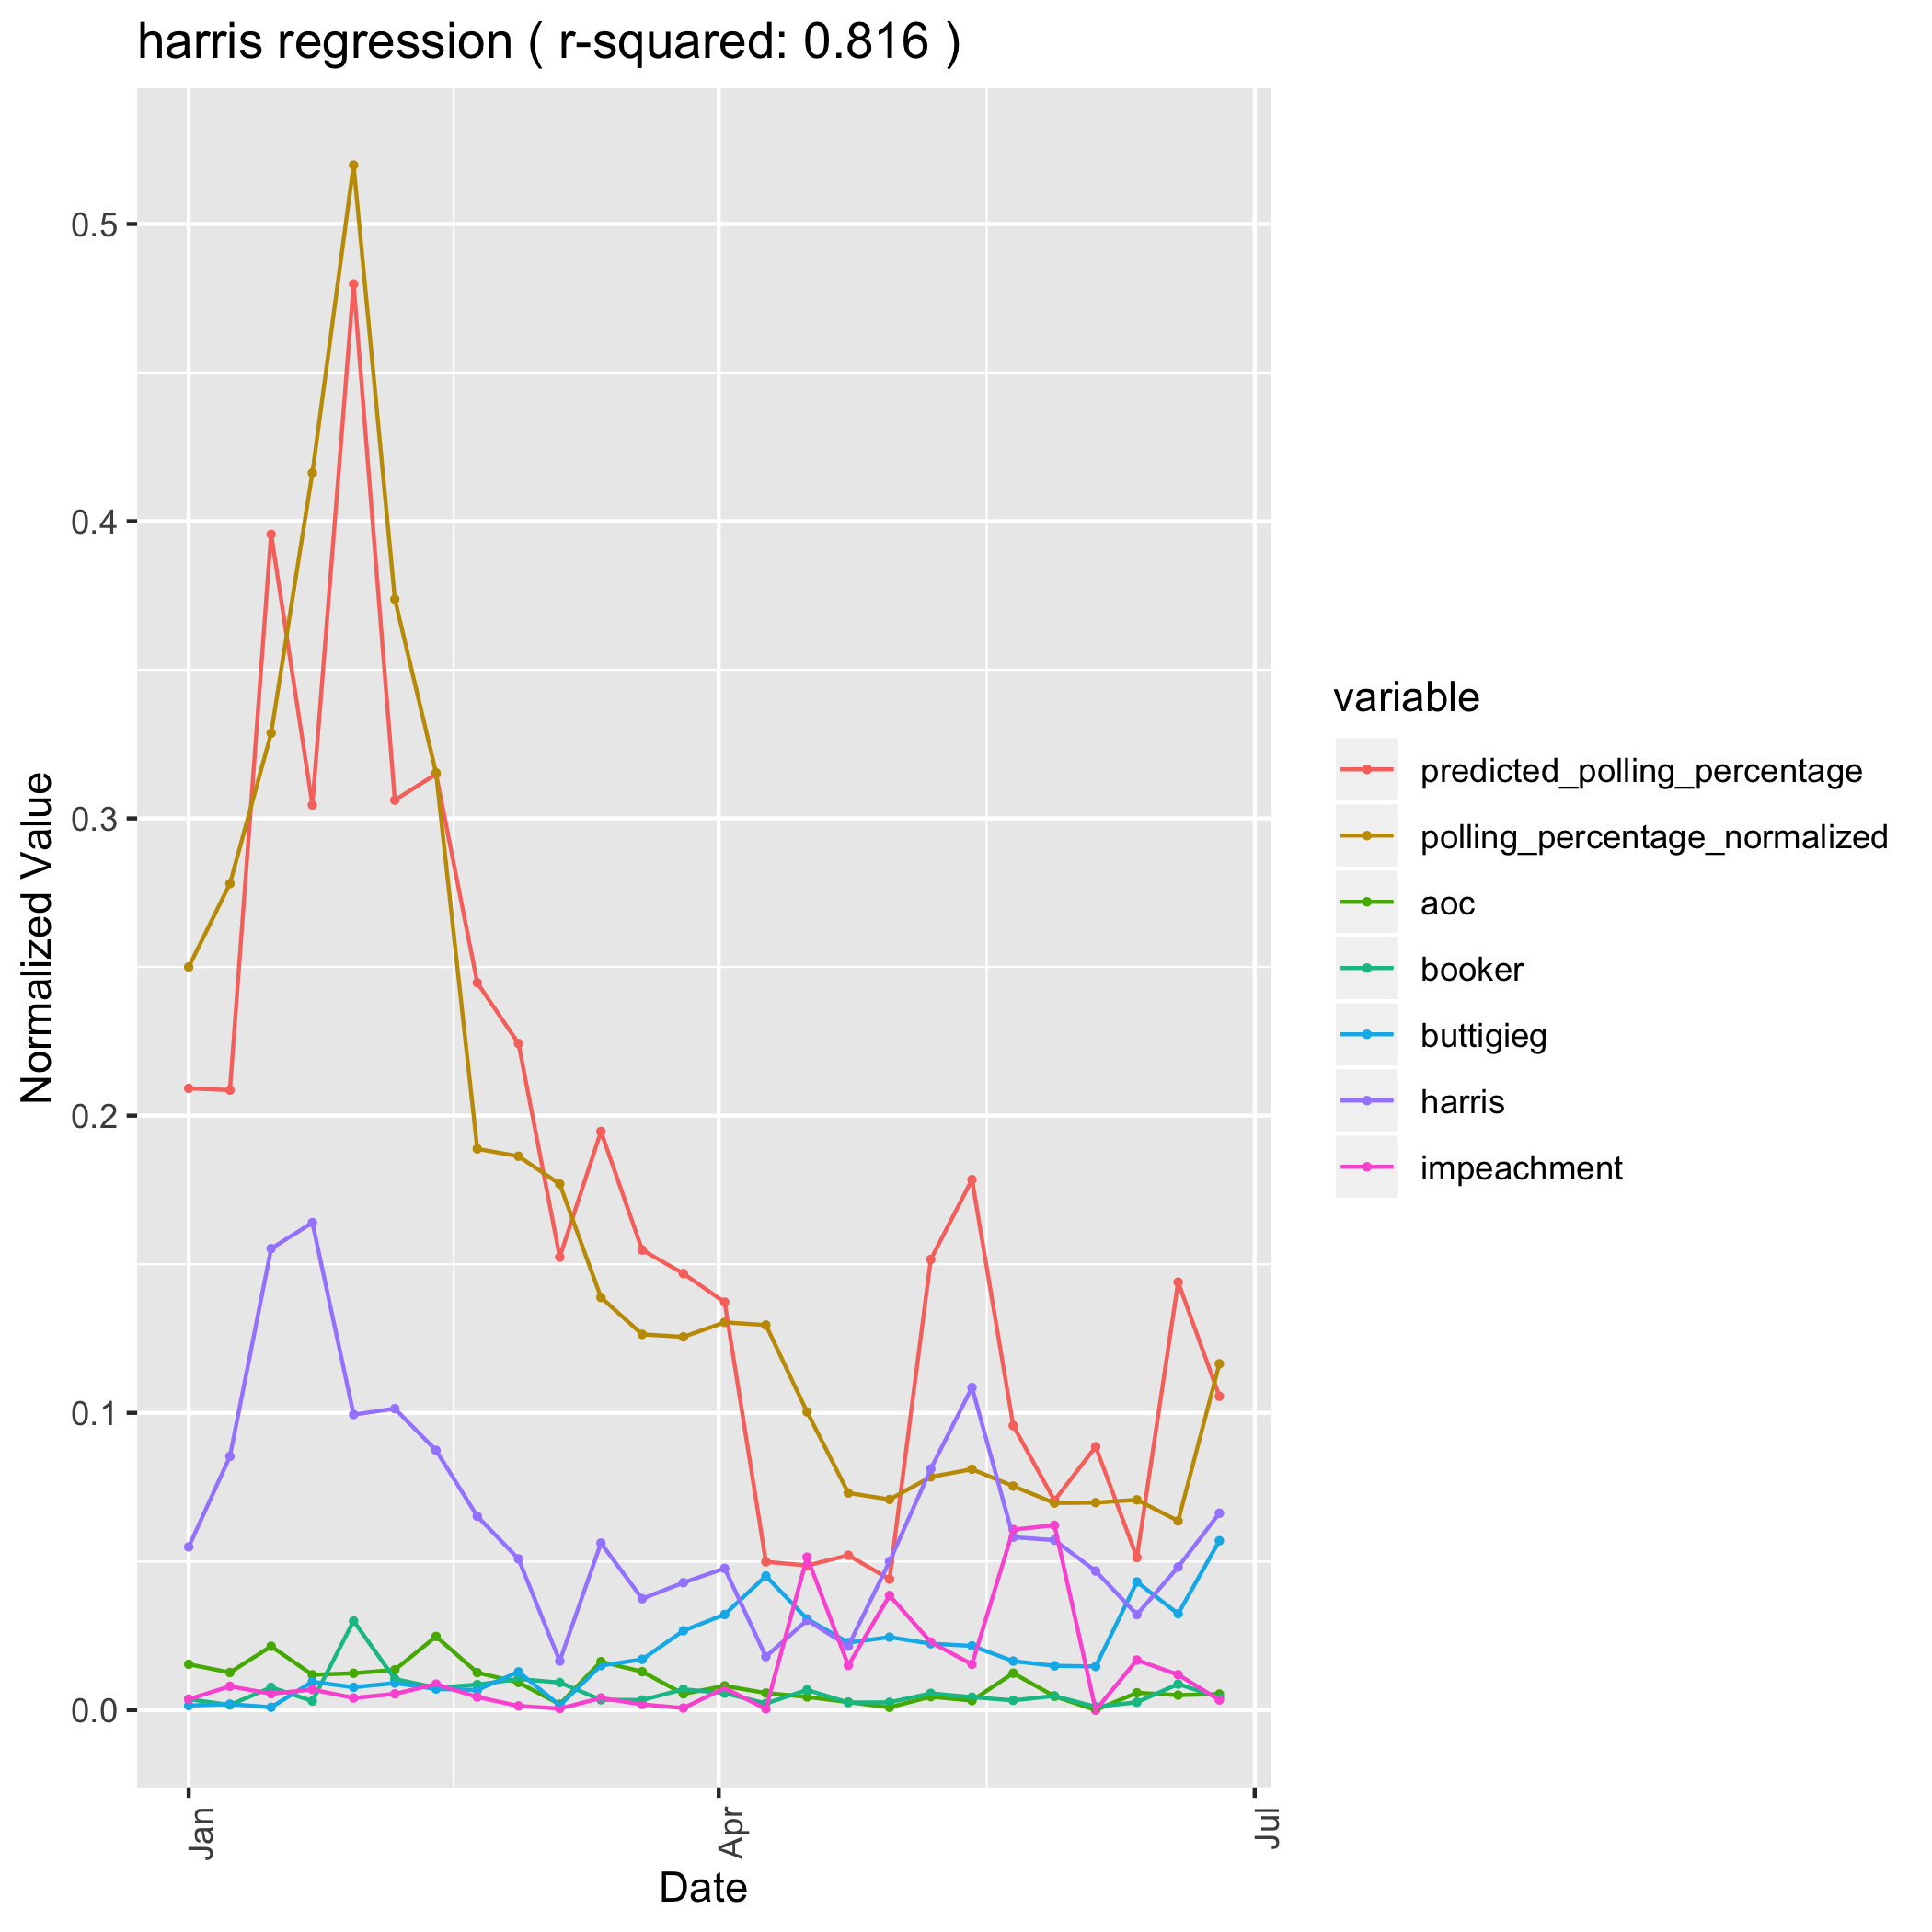
Even more than Senator Warren, Senator Kamala Harris’s campaign is driven by an identity narrative. When she is mentioned with her identity features: Black, Senator, Prosecutor, California, and Woman, she sees a positive effect in the polls. The same goes for when she is mentioned alongside AOC, Cory Booker, and other Congress Men and Women of color. Her only negative effects are when she is associated with impeaching President Trump. The negative effect of being mentioned alongside Pete Buttigeig is most likely not a causal relation, but rather that her polls (along with other candidates) dipped during the “Buttigieg Bump” in March and April.
Harris Linear Regression Model
| Coefficient | Value |
|---|---|
| (Intercept) | 0.04115 |
| (0.04560) | |
| aoc | 4.84398 |
| (2.44850) | |
| booker | 9.11061 |
| (2.26416) | |
| buttigieg | -1.34558 |
| (0.99659) | |
| harris | 1.22238 |
| (0.38406) | |
| impeachment | -1.38874 |
| (0.67514) |
Bernie Sanders
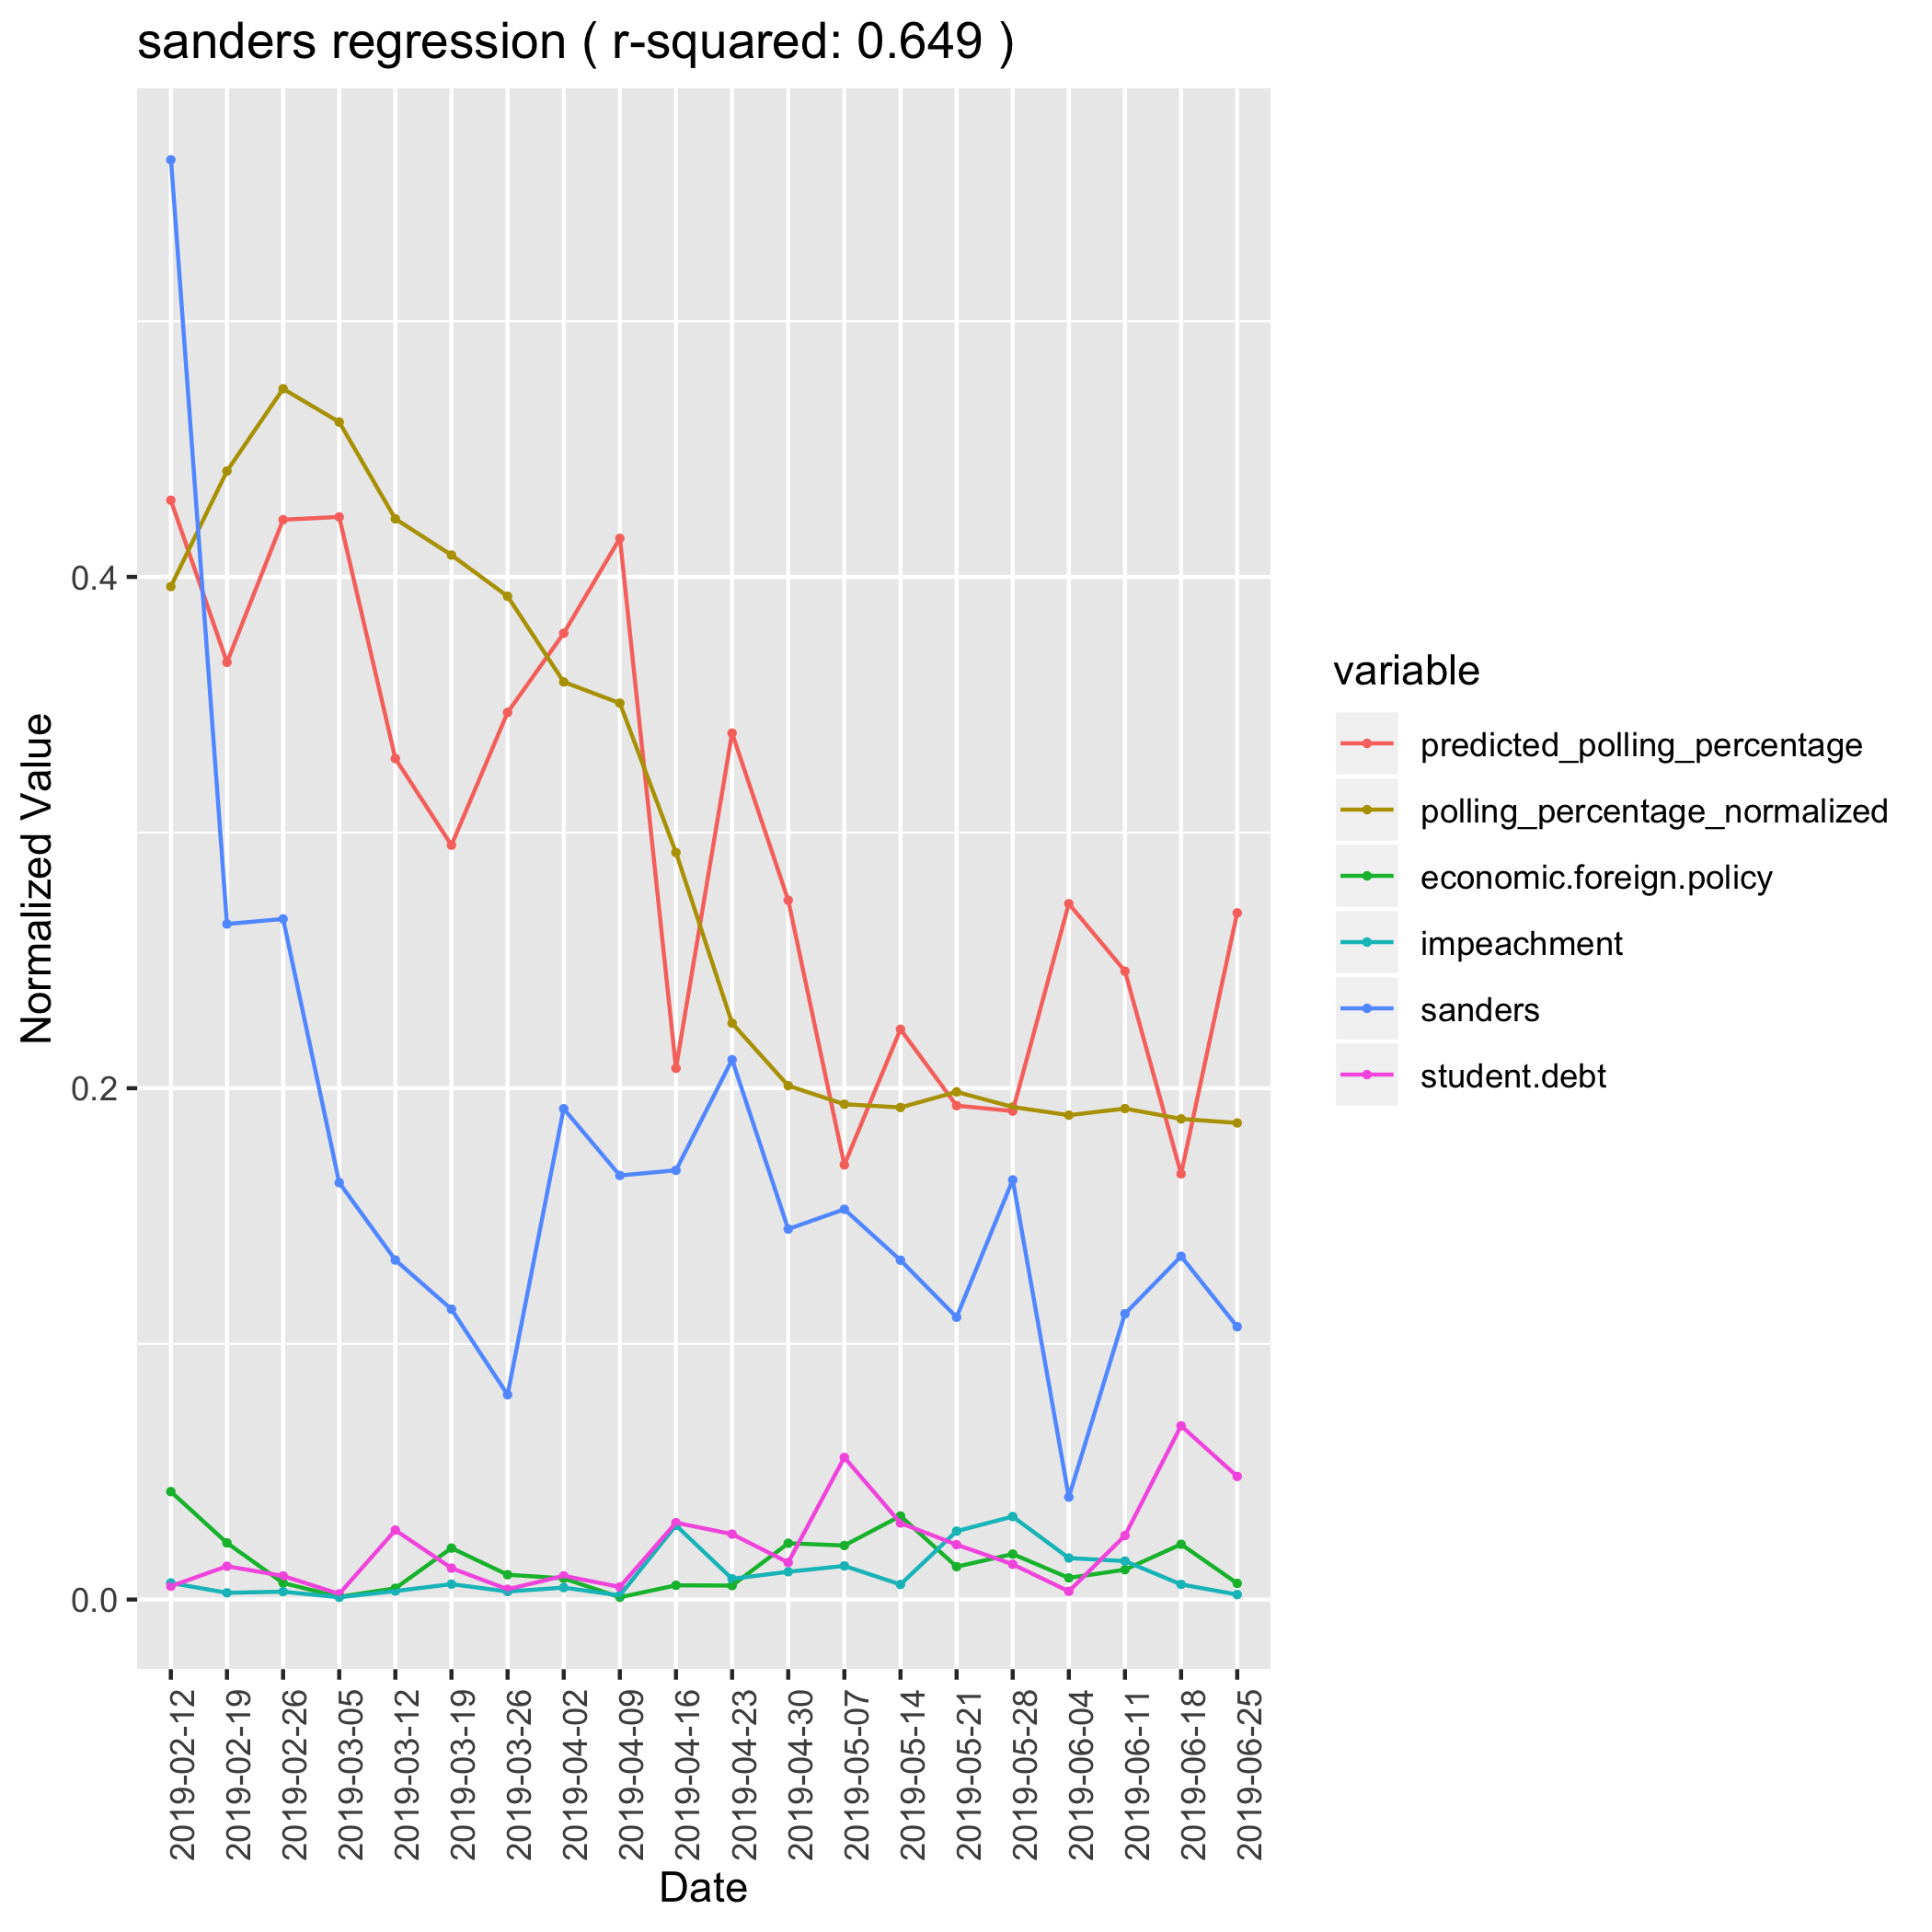
Bernie Sanders is a more difficult case. He is ideologically close to Elizabeth Warren and like Warren he suffers in the polls when his name is mentioned alongside his specific policies. In this model, both student debt and economic foreign policy have strong negative coefficients. Additionally he suffers a negative effect from his impeachment stance, which is shared by other candidates but hurts Bernie more since he has a bigger platform. Bernie’s only positive effect is his own identity topic, which was strong at the beginning of the primary but has subsided. Presumably this shows that he hasn’t caputred the level of exceitement around his 2016 bid, and people left his camp as they learned about other candidates entering the race.
Sanders Linear Regression Model
| Coefficient | Value |
|---|---|
| (Intercept) | 0.36804 |
| (0.04657) | |
| economic.foreign.policy | -3.06558 |
| (1.94783) | |
| impeachment | -4.87034 |
| (1.83321) | |
| sanders | 0.41792 |
| (0.20139) | |
| student.debt | -2.39276 |
| (1.00184) |
Pete Buttigieg
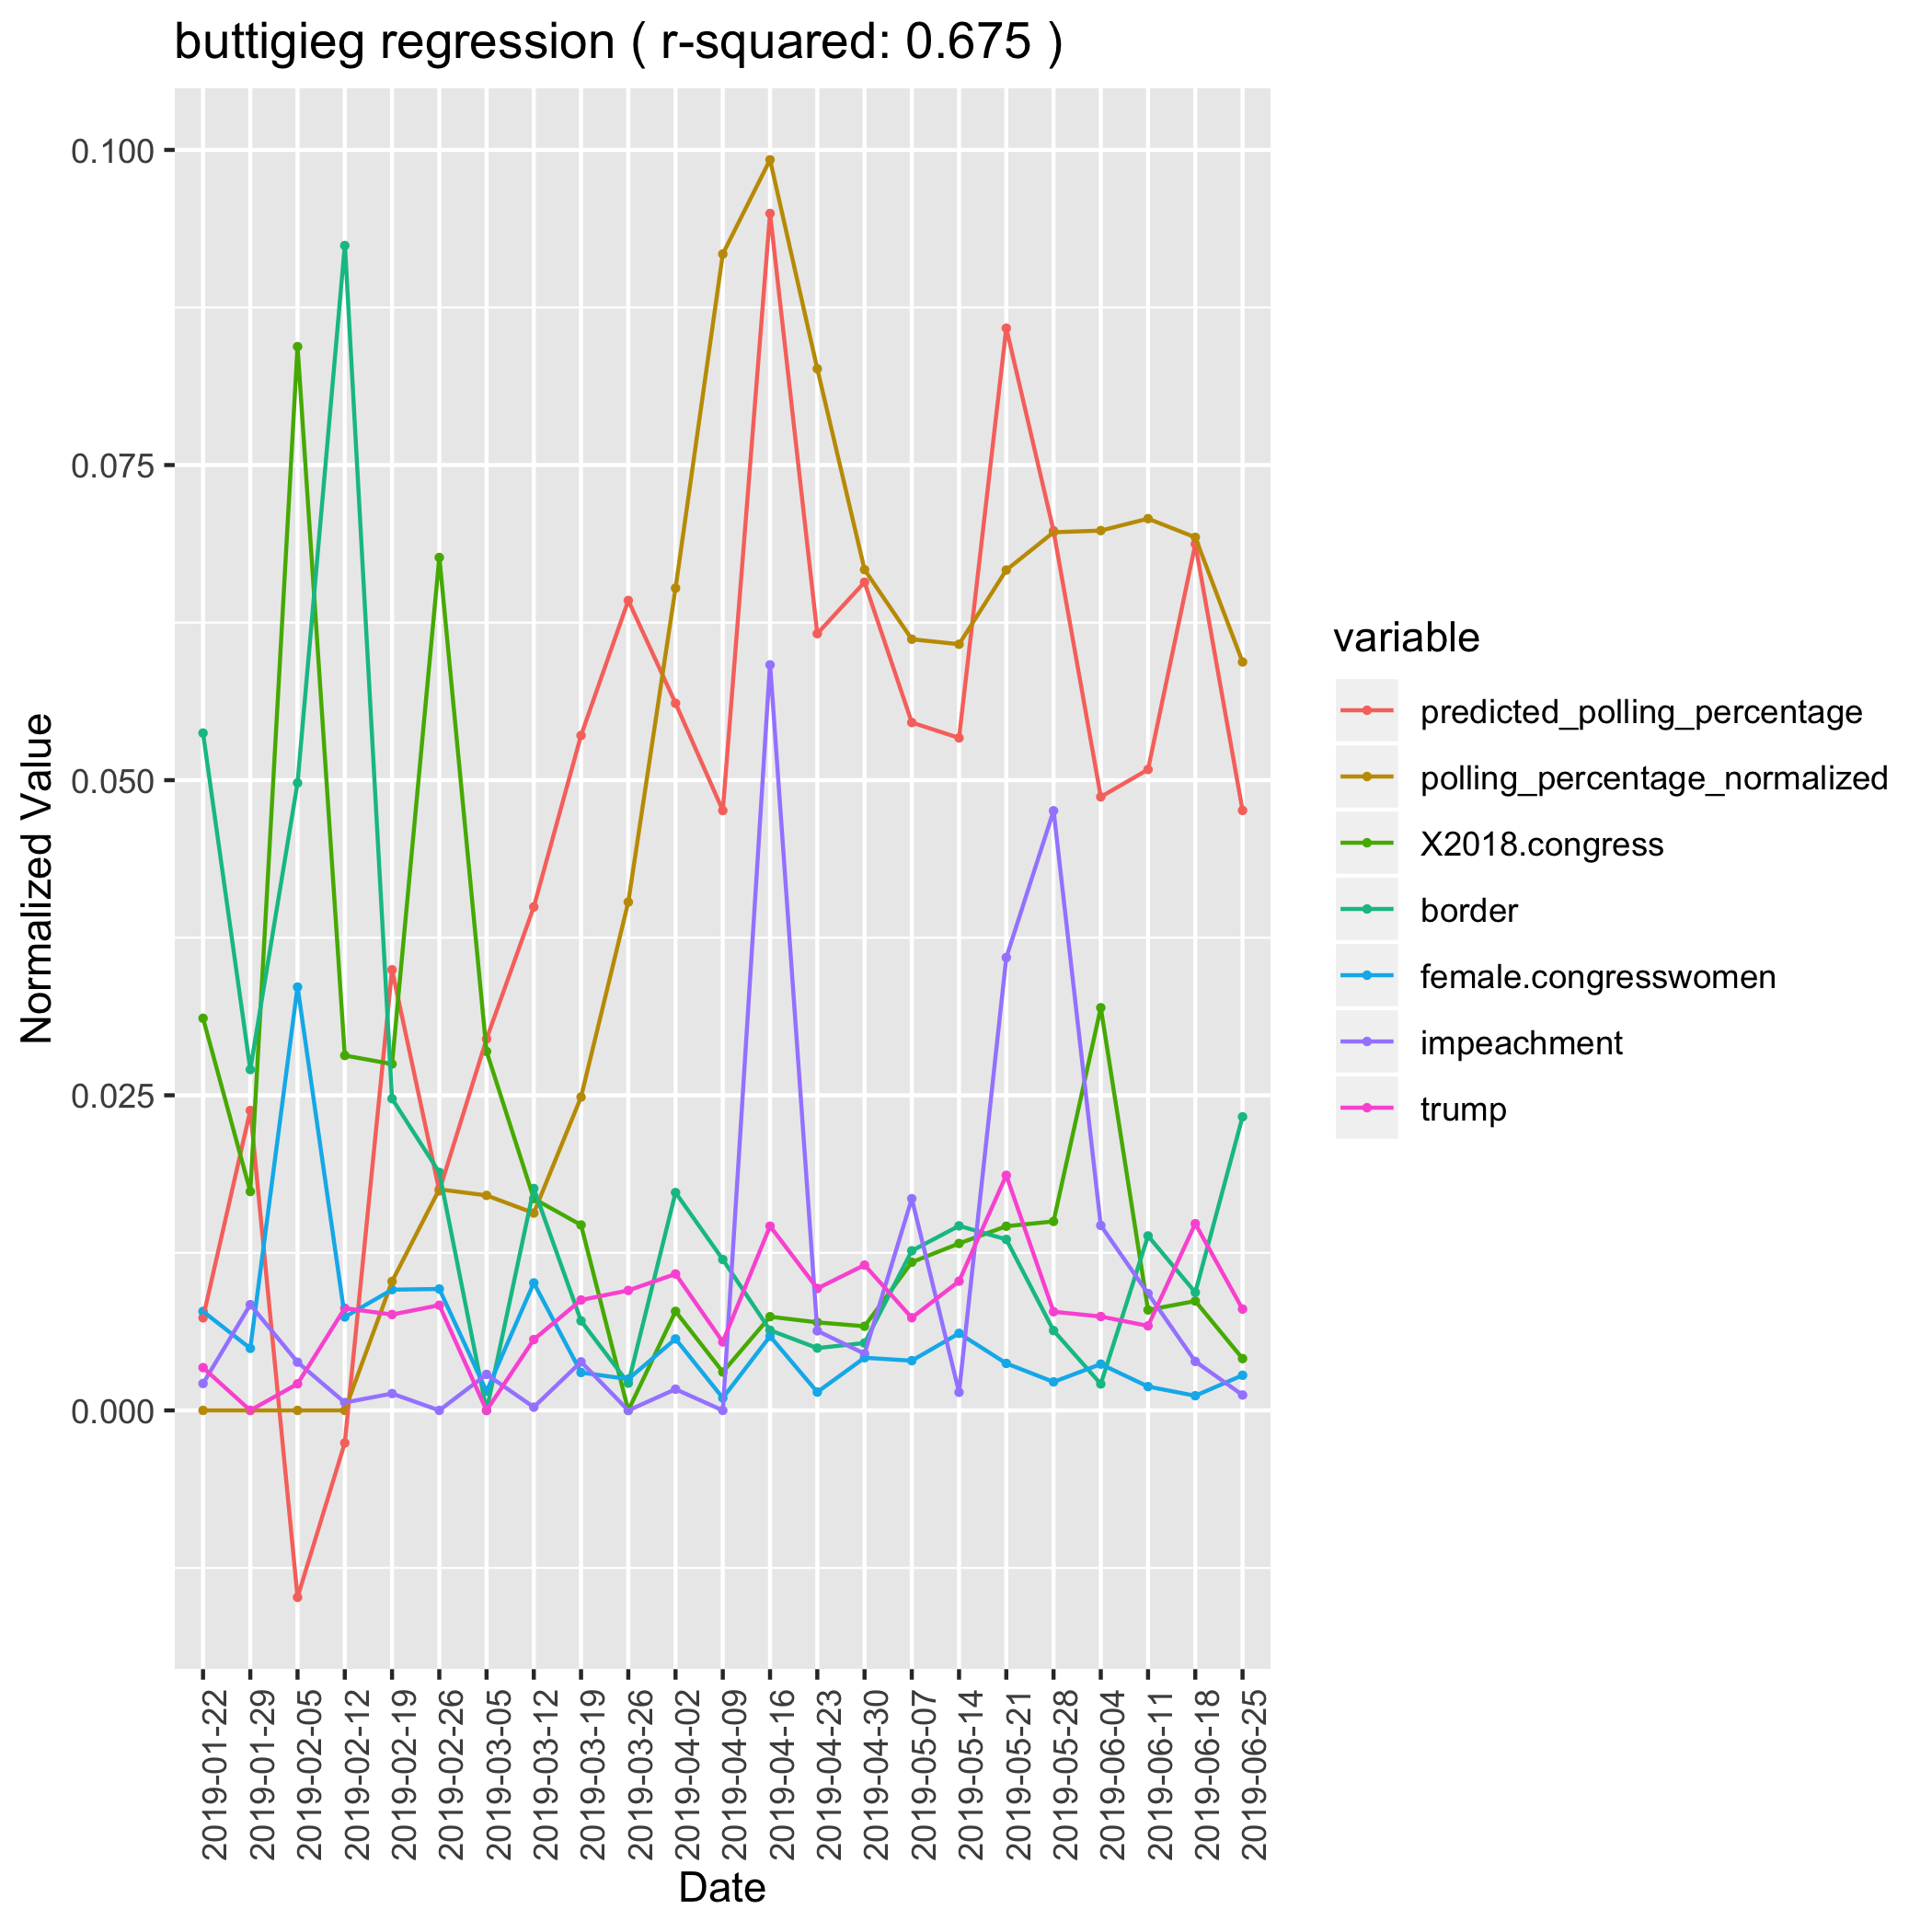
Pete Buttigieg is an extremely difficult candidate to understand in the media ecosystem. He was almost entirely unknown until a town hall in February propelled him into the upper tier of the race. He is most strongly tied to Trump administration topics like Trump, Impeachment, border, and 2018 congress (a catch-all for unspecific congressional issues, but mostly investigations into the trump campaign). Buttigieg gets a lift from these issues, most likely becuase he started his polling climb with attacks on Trump and Pence. Those topics don’t seem to fully capture the reasons that Buttigieg was climbing in the polls, as he wasn’t the only candidate attacking trump. We can also see some growth in his donations preceding his rise in polls, leading us to believe that he may have genearted some hype outside of the channels that we observed.
Buttigieg Linear Regression Model
| Coefficient | Value |
|---|---|
| (Intercept) | 0.04339 |
| (0.01298) | |
| 2018.congress | -0.54482 |
| (0.39175) | |
| border | -0.55280 |
| (0.25138) | |
| female.congresswomen | 0.26647 |
| (1.18763) | |
| impeachment | 0.41763 |
| (0.31462) | |
| trump | 2.24852 |
| (1.19288) |